


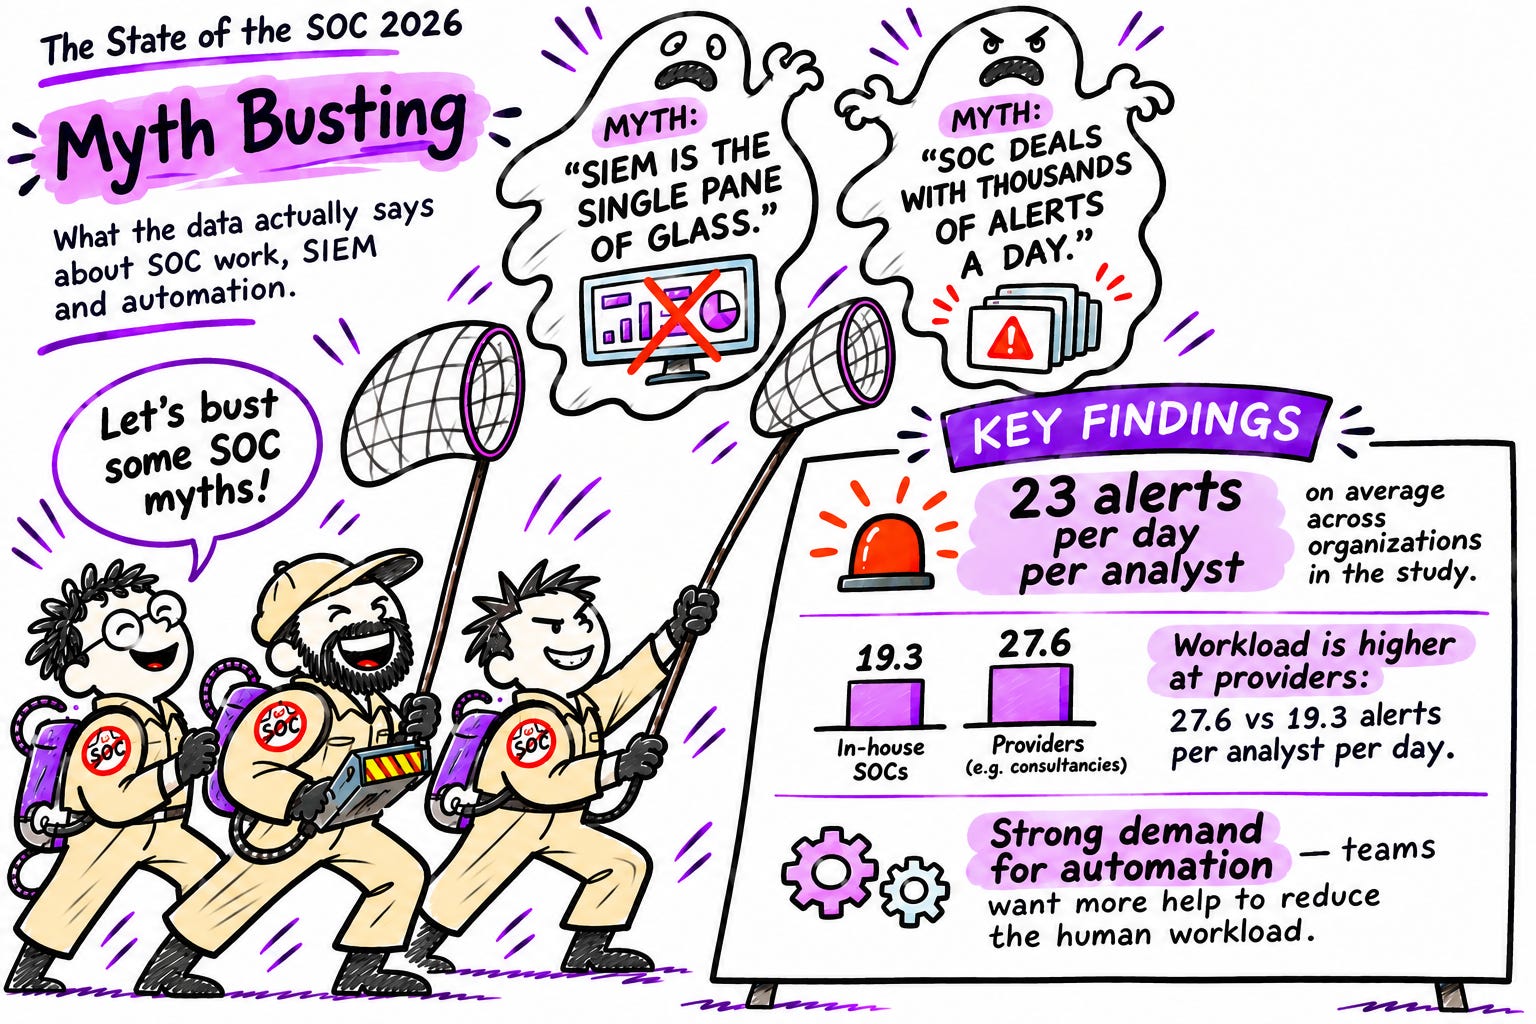
The average analyst in our survey handles an estimated 23 alerts a day that need a human to look at them. That is after tuning, suppression and automation. It sounds modest next to the thousands of daily alerts often quoted in industry reports, but it can still fill a working day.
We ran this research because we wanted a clearer picture of the work SOC teams actually do. BridgerWise Research and SecOps Unpacked contacted SOC leaders directly, with one response per organization, rather than publishing an open survey link. The research was non-sponsored and vendor-neutral.
The result is a picture of uneven workloads, strong demand for automation and gaps in the feedback loops used to check the work. Here are the findings we think matter most.
Watch the our webinar where we break down the report
Start with the work that reaches a person
We asked how many alerts require human triage each month after tuning, suppression and automation. Then we estimated daily workload using team-size bands, 20 working days and deductions for managers and specialist roles.
Across the 105 respondents who supplied workload and staffing answers, the modeled mean was 19.3 alerts per analyst per day for in-house SOCs and 27.6 for providers, including consultancies. The overall mean was 23.
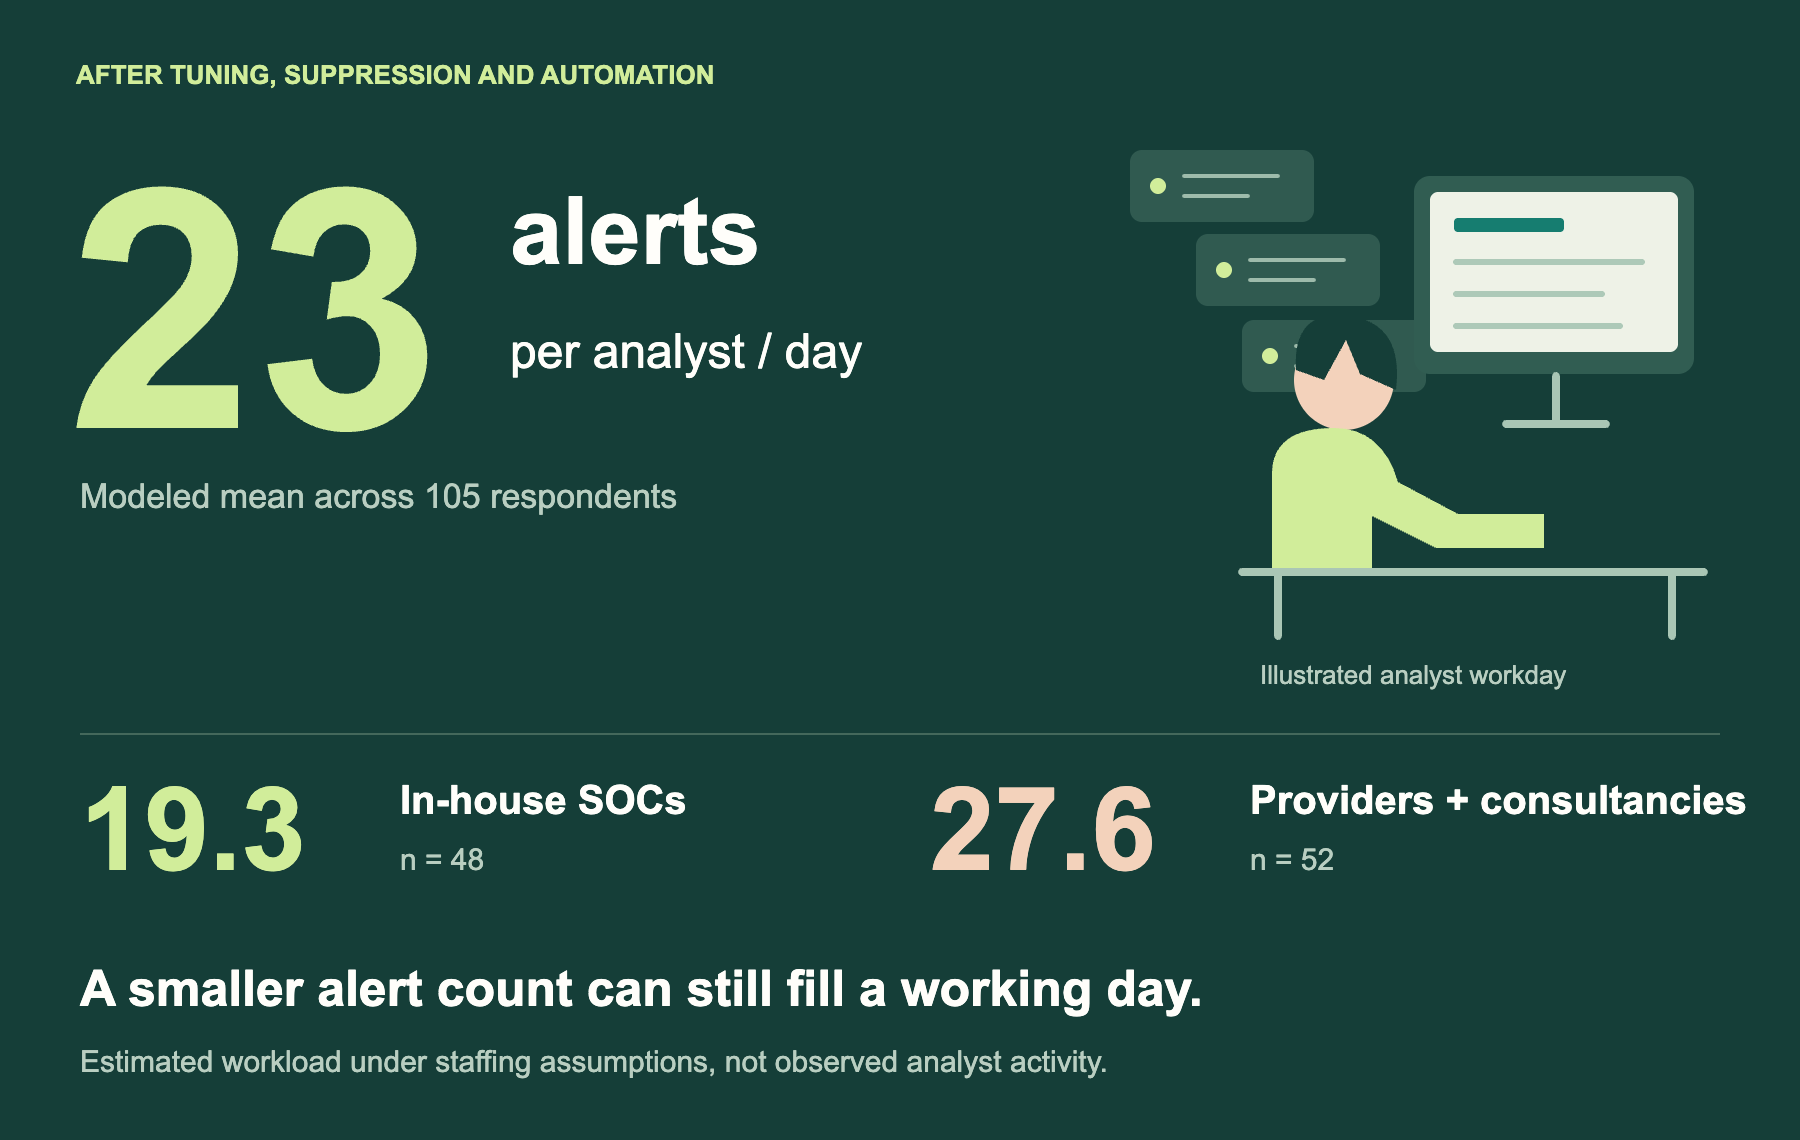
These are estimates, not observed analyst activity. Staffing assumptions matter, and averages give unusually busy teams more weight. The full report explains the model and tests alternative assumptions.
Even so, the time budget is useful context. An eight-hour shift with a 30-minute break leaves 450 minutes. At those average workloads, that is roughly 23 minutes per alert in-house and 16 at providers, assuming the entire shift goes to alerts. Reporting, detection tuning, user requests and other duties still need time.
Our take: 23 is still a lot. Twenty-plus alerts a day that need human judgment is not a comfortable shift for any analyst. Timing matters too. We ran this survey before AI was widespread in most SOCs. When we repeat it next year, we expect the number to be much higher, possibly double, because each alert should take far less human effort. Building an incident timeline used to take hours. Writing SIEM queries by hand, and getting them right on the fifth try, is now simplified. Or at least it should be.
Raw alerts generated by tools, alerts reaching a SOC and alerts requiring human triage are different measures. Comparing them without their definitions makes workload look simpler than it is.
A cleared queue needs a feedback loop
More than half of respondents, 56%, say they leave no alerts ignored or closed without investigation. When alerts are left behind, respondents describe several practices: accepting risk based on severity, carrying work to the next shift, bulk-closing alerts and letting them expire.
Those choices have different implications. Carrying a case forward is different from closing it without review. Neither the queue count nor the closure rate tells us whether the decisions were sound.
Only 23% of respondents select a formal QA programme with defined sampling, scoring and feedback loops. Another 23% report no QA process. Informal or risk-based review is the most common answer, at 38%.
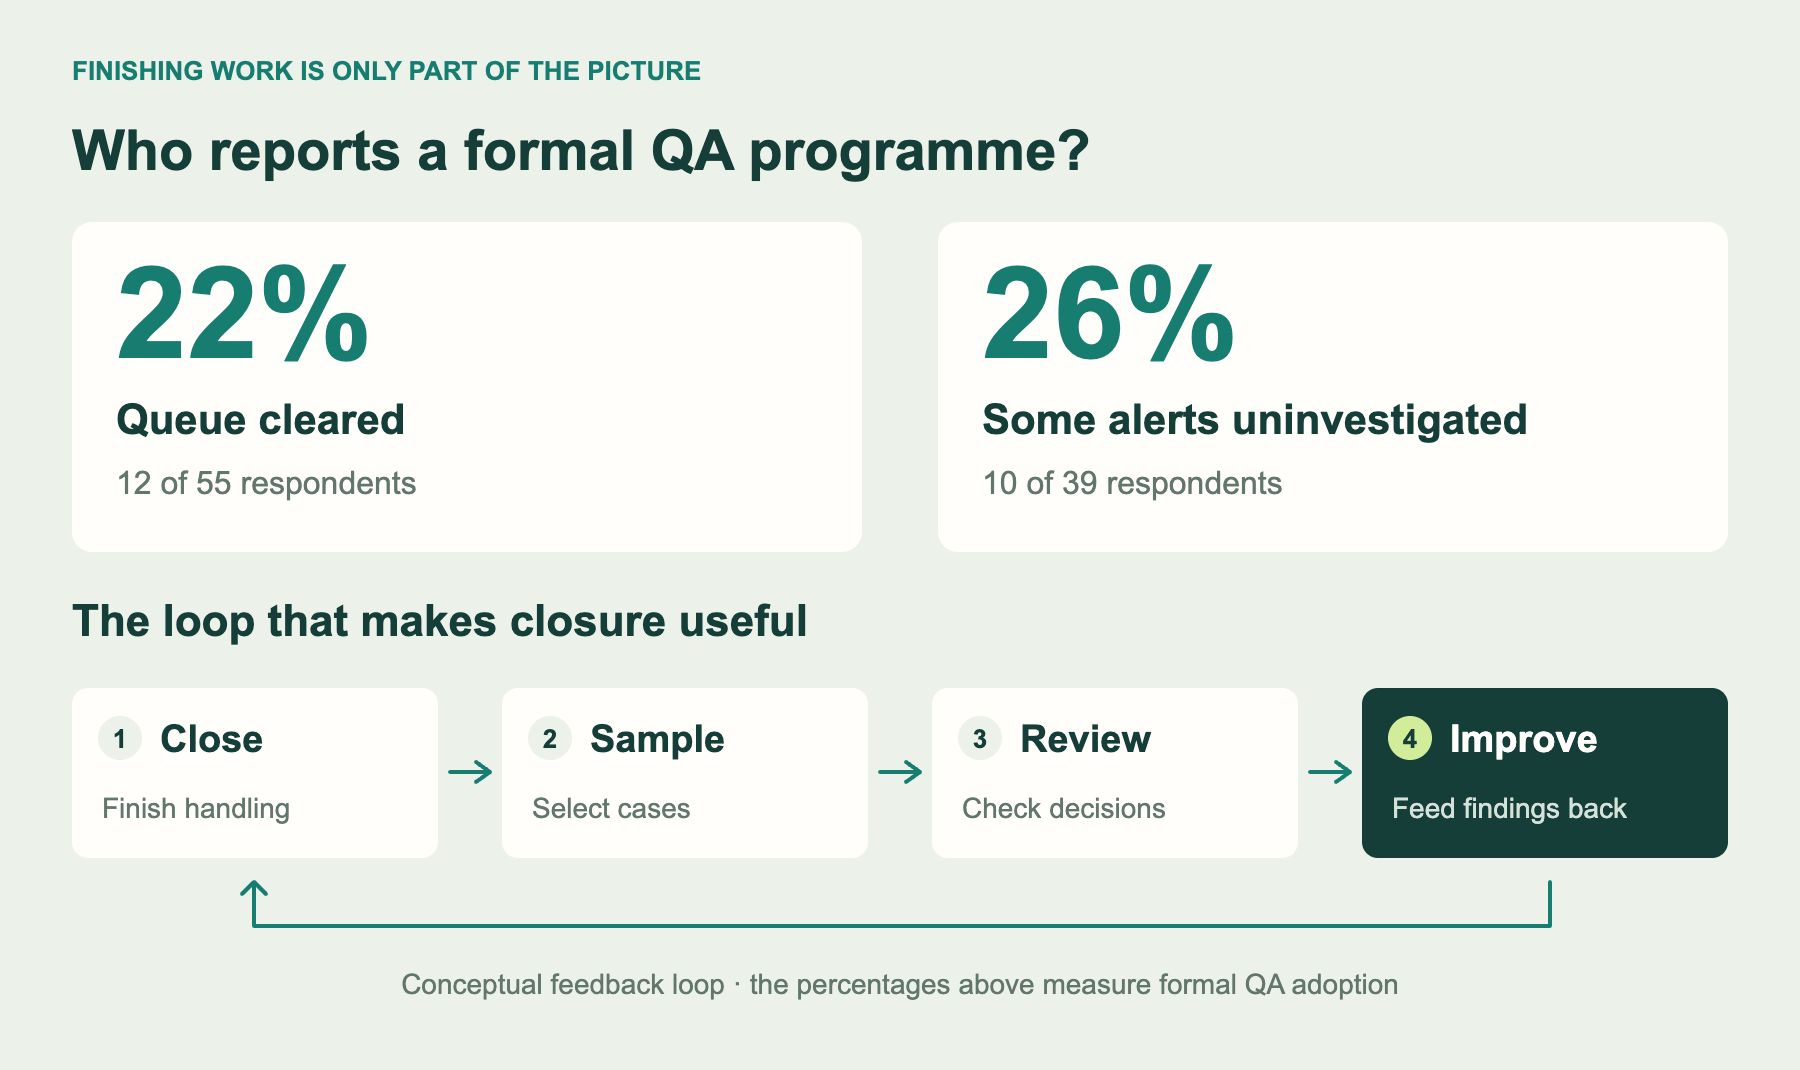
The formal-QA rate is similar among teams that clear their queue and those that leave some alerts uninvestigated: 22% versus 26%. Clearing work and checking it deserve separate measures.
This matters as AI takes on more triage and investigation. Moving analysts into oversight still requires a way to sample decisions, identify mistakes and feed corrections back into the operation.
The same fatigue headline can describe different problems
Providers name alert volume or fatigue as a top-three challenge twice as often as enterprises: 52% versus 26%. Enterprises cite budget constraints more often, at 45% versus 27% of providers.
False positives, however, are selected by 30% in both groups. The difference in fatigue is larger than the difference in false-positive concerns.
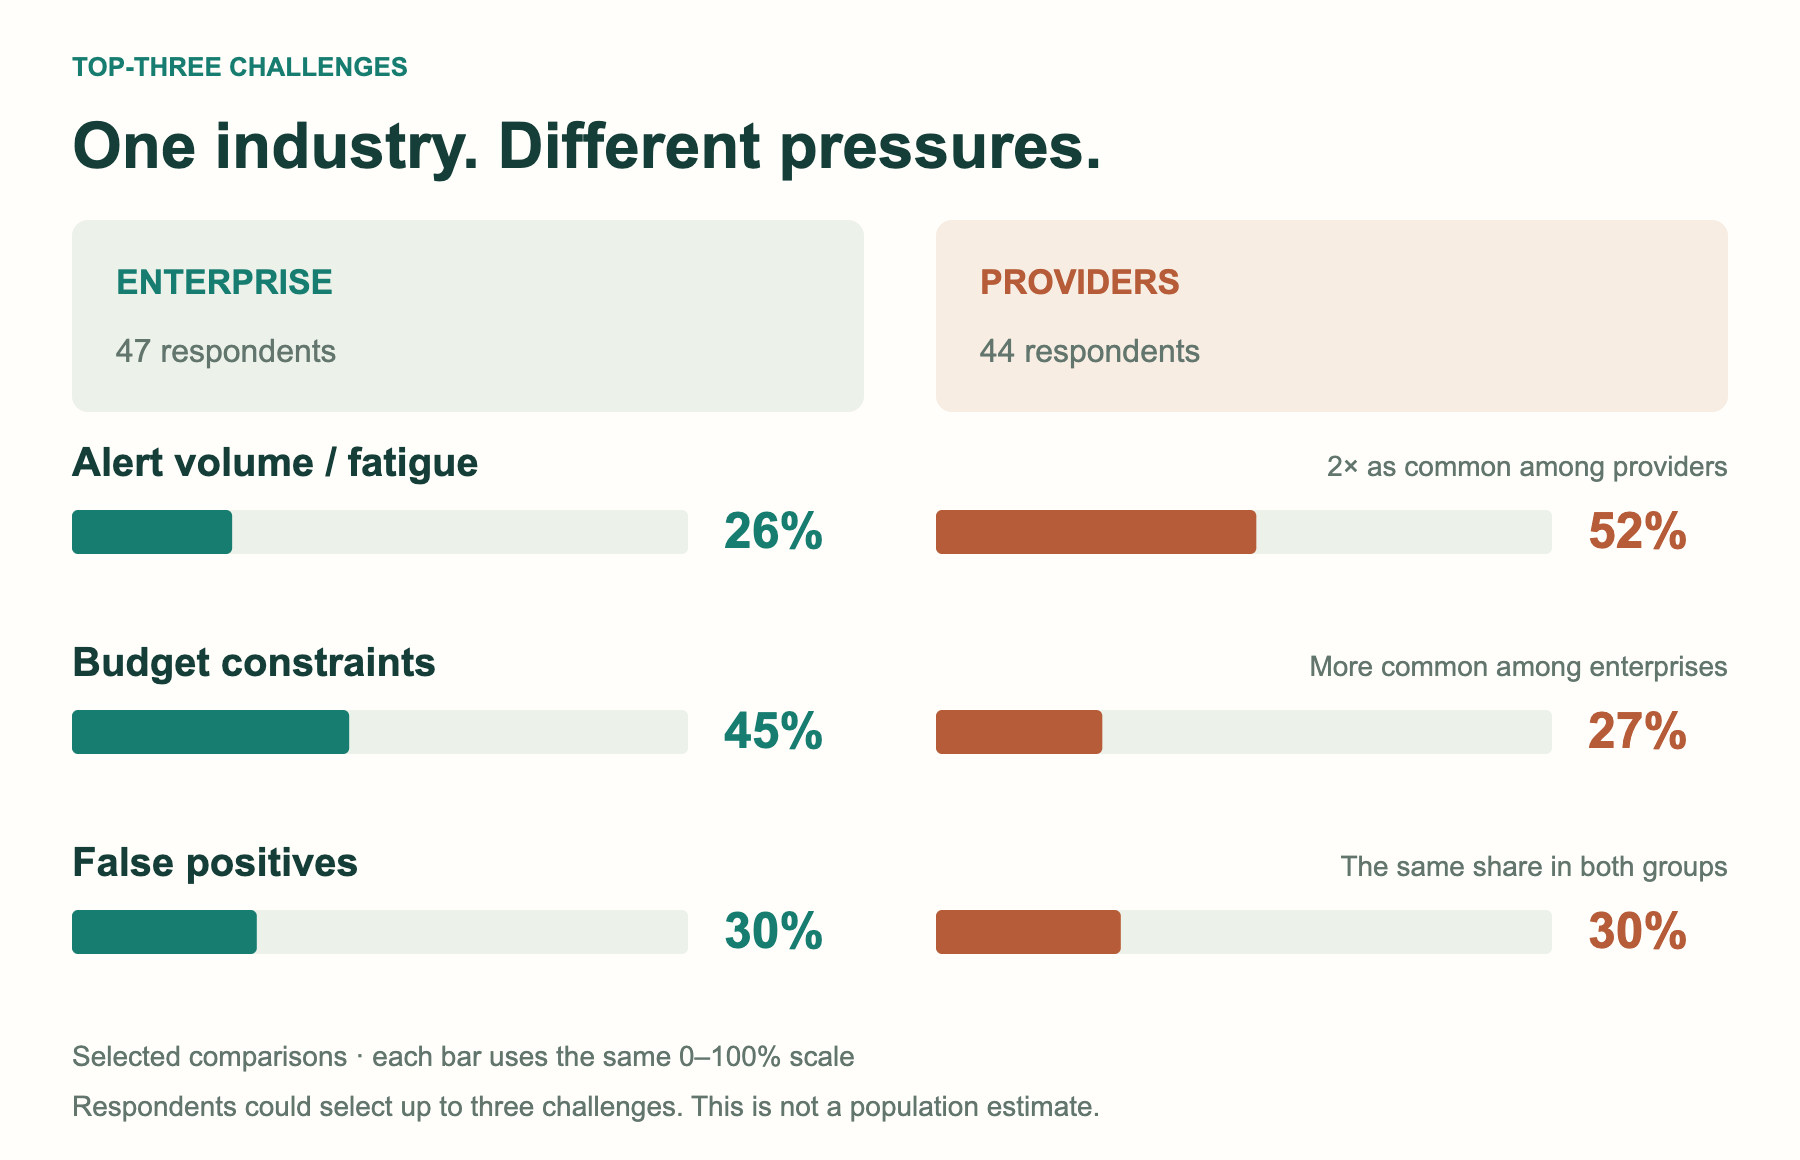
This is why we would be careful with a single industry-wide fatigue number. Customer scope, staffing, operating model and the question asked all affect what it means. Our survey describes the SOC leaders who answered; it is not a random or population-weighted sample of the industry.
Automation demand extends beyond fatigue
Automating Tier-1 tasks is the leading priority, selected by 68% in the report’s priorities table. Interest is almost identical among respondents who name fatigue as a leading challenge and those who do not: 68% and 67%, respectively.
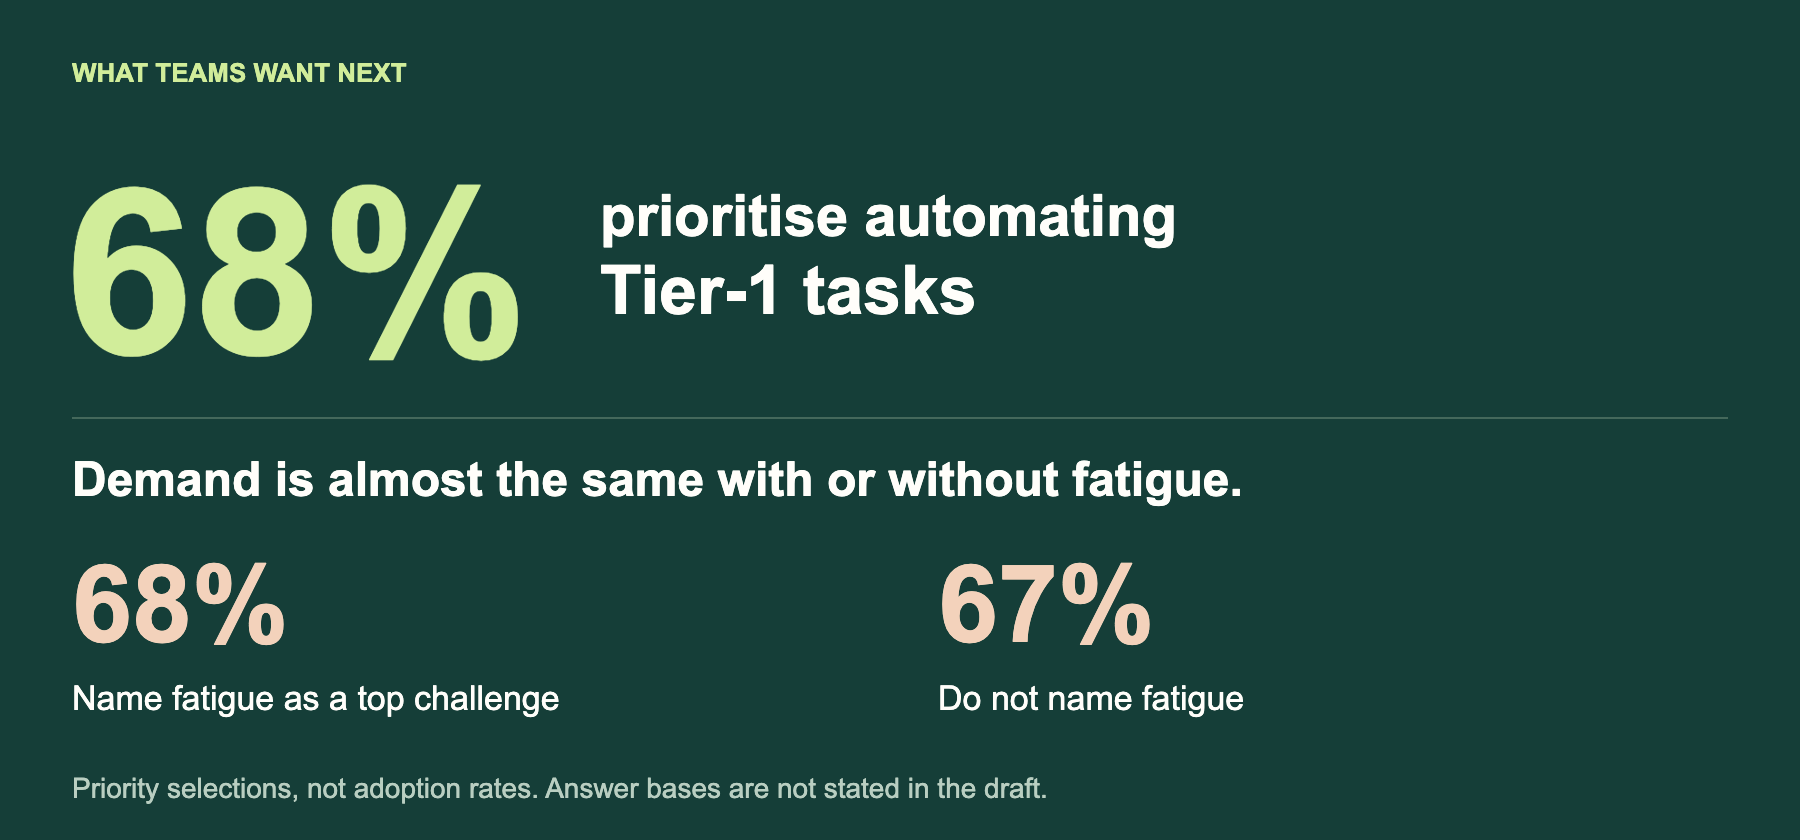
That helps explain the appeal of the AI SOC message. Teams want less repetitive work. It does not establish that AI is the only way they expect to achieve it, or that automation removes every queue problem.
People remain important at higher automation levels. In the small group closing at least 76% of alerts automatically, 73% prioritise retaining or developing talent and 64% prioritise scaling without adding headcount. We see this as a signal worth exploring, rather than evidence that automation caused those priorities.
Measure detection beyond the SIEM
62% say the SIEM first detects half or fewer of their incidents. An incident may first surface through endpoint, identity, email or cloud security tooling, or through a person, and still be triaged in the SIEM.
Where an alert is investigated and where it originated are different questions. Detection coverage needs to account for the tools producing the detections, including those whose rules are maintained by a vendor.
Report the measures you can stand behind
MTTR is the single metric most often reported to leadership, at 25%, but only 13% personally trust it most. Confirmed incident counts and detection coverage lead the trusted list, at 20% and 18%.
Different audiences need different information. A useful SOC scorecard should explain workload, the checks behind verdicts, detection coverage and security outcomes. Speed can contribute to that picture, but it cannot answer all four questions.
For your own SOC, start with the alerts that reach people. Check how staffing and scope affect the workload. Review closed work and use the findings to improve detections and guidance. Then ask whether the metrics reaching leadership describe the operation you actually trust.
The full State of the SOC 2026 report includes the detailed findings, response bases, staffing model and limitations. Participation and completion vary by question; all findings are self-reported.
Read the full State of the SOC 2026 report
Check out our SecOps Market Landscape tracker and evaluation frameworks
Discussion about this post